Allegrobotics - Photovoltaic performance by solar irradiance.
Using a small solar panel to measure sunlight intensity to make a poor man's pyranometer.
Why?

To measure sunlight intensity.
Yeah, but .. why?
There are many reasons to want to know the current irradiance.
Evaluate an installation proposal. Evaluating how much energy solar panels will generate if they are installed. Solar installations are affected by many things - cloud cover, time of year, latitude, air temperature, elevation, shading, installation angle, installation direction. These can be modelled, but are sometimes better actually measured.
Working out what to do with the power being generated by an existing system. A grid-feed system generally routes excess power into the grid for a paltry few cents per kWh, but it is also possible to make hay while the sun shines and store the energy in other places when it is cheap.
- Hot water heating - some households use 1/3rd of the electricity use on heating household water. 'Off-peak' is normally the middle of the night, but solar creates a new off-peak, which is the middle of the day.
- Pumping water to an elevated tank - off-mains-water homes use electricity in turning on a pump for the household water. Water can be pumped to an elevated tank when energy is plentiful. This also ensures a smooth and constant water pressure.
- In-slab heating - resistive in-slab heating is prohibitively expensive even with off-peak power. However, if the power is cheap enough, then it becomes viable. The ('lost opportunity') cost of in-slab heating is your feed-in tariff price, and that's going down dear reader, not up.
These issues are even more important for an off-grid solar site which uses battery storage. The batteries could operate on-demand at any time, but batteries are expensive and have a limited cycle life. It's better to bypass the batteries by storing the energy as elevated or heated water, or heated thermal mass.
Commercial solar inverters and charging systems (such as the Victron MPPT chargers) frequently provide useful digital information via a computer-compatible interface, but don't provide a direct measure of irradiance.
Process

Irradiance meters are quite expensive. Irradiance meters which do logging are even more expensive. It should be possible to log solar irradiance with a small solar panel and an Arduino.
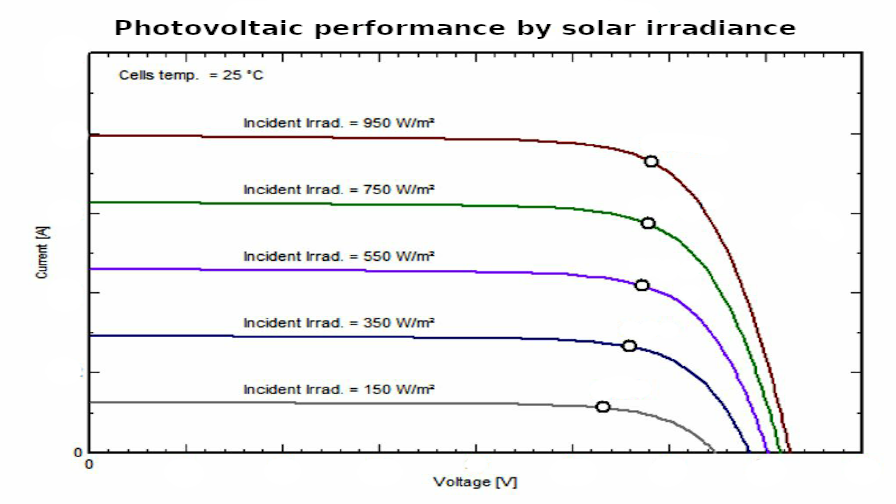
The following graph shows the relationship between voltage and current for a typical photovoltaic panel,
with different irradiances. Clearly current, voltage and power all decrease with reduced sunlight, but the
relationship is interesting.
The current (A) and voltage (V) scales have been removed to make this a generic graph -
most photovoltaics will have very similar curves, just with different scaling on the axes.
In measuring the incident irradiance, it might be tempting to just mount a solar panel and measure the open-circuit voltage, but we can see that it is not linear. (look at the points where the curves cross the (horizontal) voltage axis). A better measure is the closed-circuit current - (look at the points where the curves cross the (vertical) current axis). This is the current (Amps) which will flow if the positive and negative on the panel are shorted. These values are quite linear with respect to irradiance.
Arduinos (such as the Nanos) have pins which can measure 0 to 5V, but no way of directly measuring current.
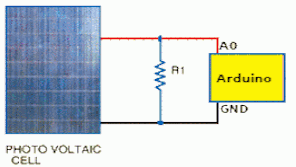
This can be done with an an Arduino add-on current sensor
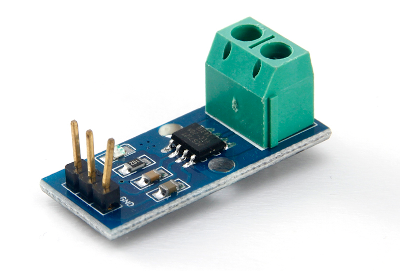
but basically this will just put the current through a shunt (low ohm resistor), and measure the voltage.
So putting an appropriate resistor across the photovoltaic terminals and measuring the voltage should do just as well.
Examine the red line on the following graph.
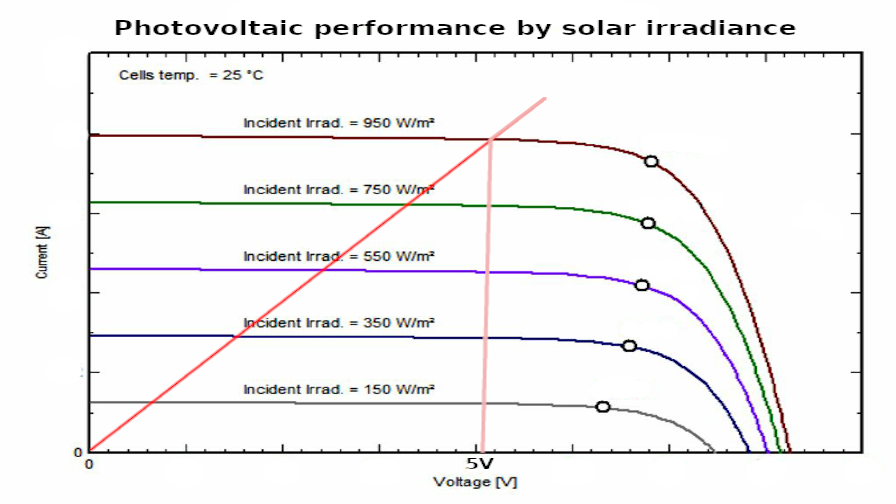
The slope of the red line is the conductance (ie 1 / resistance) of the resistor.
So the resistance (Ω) must be
- small enough that it intersects only the straight part of the curves (ie
current < voltagemax / currentmaxorΩ < Vmax / Imax) - never result in voltages more than 5V (for a 5V Arduino) (ie
resistance < 5 / currentmaxorΩ < 5 / Imax) - have a maximum value which is reasonable measurable for an Arduino - less than 1V for full sunlight seems a bit low for accuracy
and precision (ie
resistance > 1 / currentmaxorΩ > 1 / Imax).
A good start would be to a solar panel which is rated at more than 5V,
and use resistor of 3 / currentmax Ω.
Arduino Warning
Solar Voltage
Intuitively, the highest voltage/power/current from a solar cell will be on a hot summer day, but this is not true. A hot solar panel has a higher resistance, so is actually less efficient. The highest values will be on a cold sunny day with the panel inclined to point straight at the sun.
Don't turn the Arduino into a latter day Icarus.
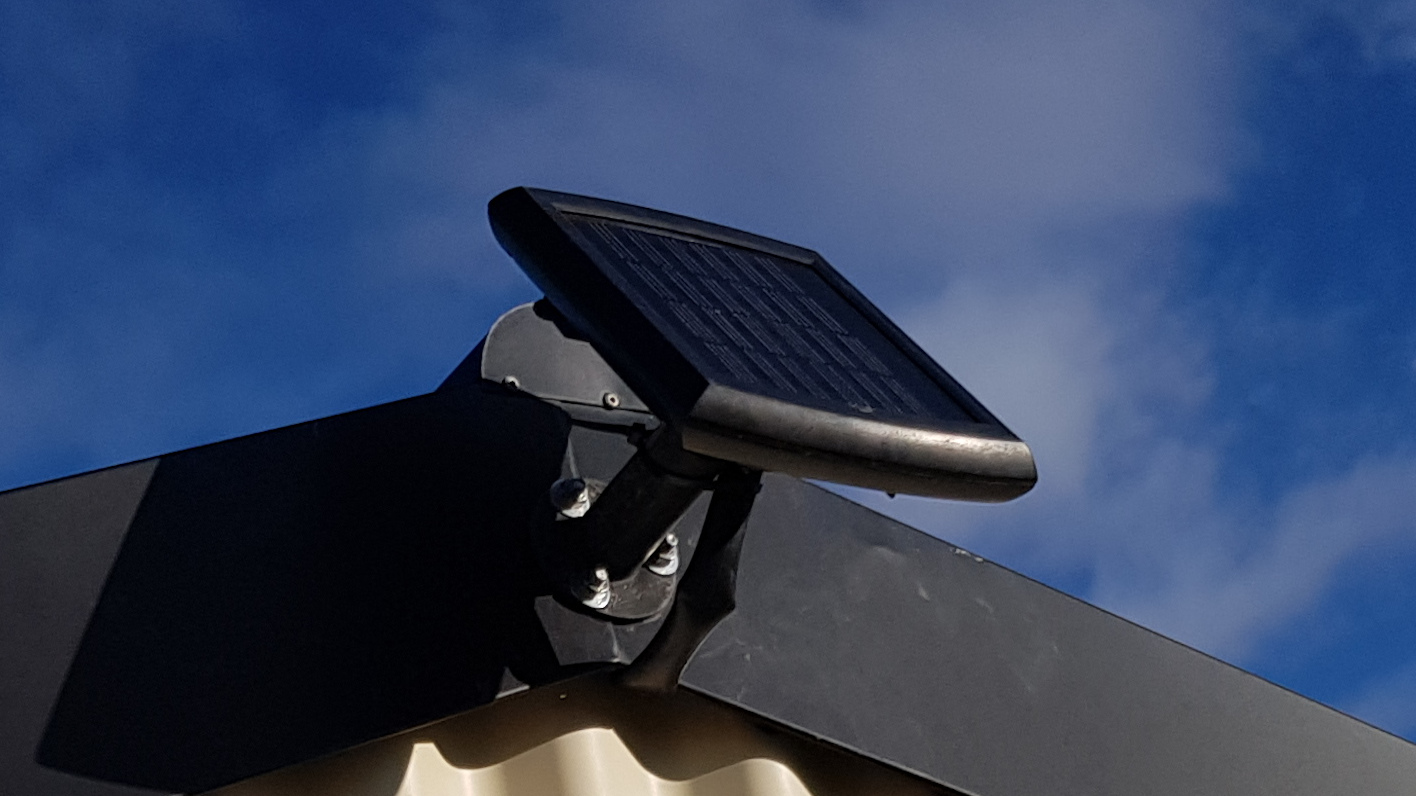
Panel
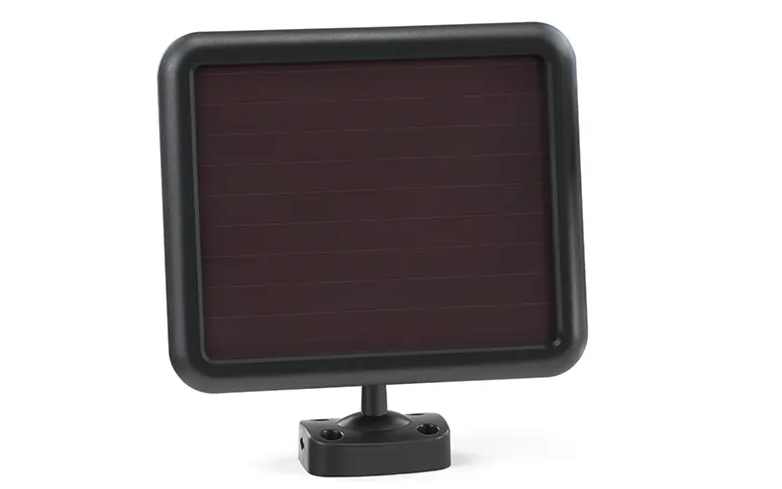
Small solar panels can come in convenient mountable water-proof cases when you buy solar garden lights or a solar shed light. Sometimes you can score a second hand one which the owner has given up on because it no longer works. Often the batteries or circuit board are shot, but the case and panel are still good, and they are nominally 6V, which is a convenient voltage to work with.
Program
 The following Arduino program is all that is required.
#includevoid setup() { delay(2000); // Delay before anything starts, because that's good practice. Serial.begin(19200); // Communicate back to the host at a moderate pace while (!Serial) delay(1); // Wait until serial is set up. delay(1000); // And wait some more. } uint32_t nextReadVoltageAt = 0L; void readAndReportVoltageIfNecessary(int32_t now) { if (now > nextReadVoltageAt) { int voltage = analogRead(A0); Serial.print("voltage="); Serial.println(voltage); nextReadVoltageAt = now + 1000; } } void loop() { readAndReportVoltageIfNecessary(millis()); }
the program will only write the raw values (0..1023) and these must be calibrated. The easiest way to run it on a cool sunny with the panel pointed directly at the midday sun, and treat the resultant value as 100 percent. Then scale everything from there.
Results
Here is a graph of the output for a typical sunny winter day.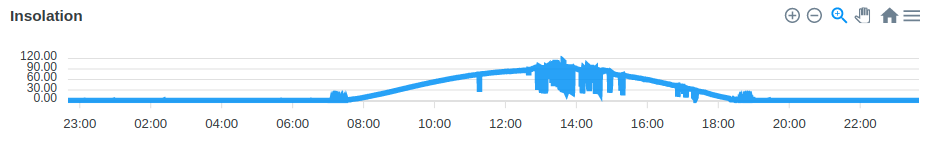
- As expected, the graph follows a kind of sinusoidal.
- The graphing tool is a bit misleading - the lumps at first light and last light are actually much smaller than the graphing package makes them appear.
- There are dips in the day which are presumably intermittent cloud cover.

Leave a comment
 Something I'm doing wrong? Solved my problems? Got a better idea? Got a similar problem?
Think I might have solved your problem? Ninety-nine problems, but your robot ain't one? Say so ..